Spreadsheet Dependency
Critical weekly reporting still relies on someone manually downloading data, running macros, and compiling a PDF.
Custom Dashboards
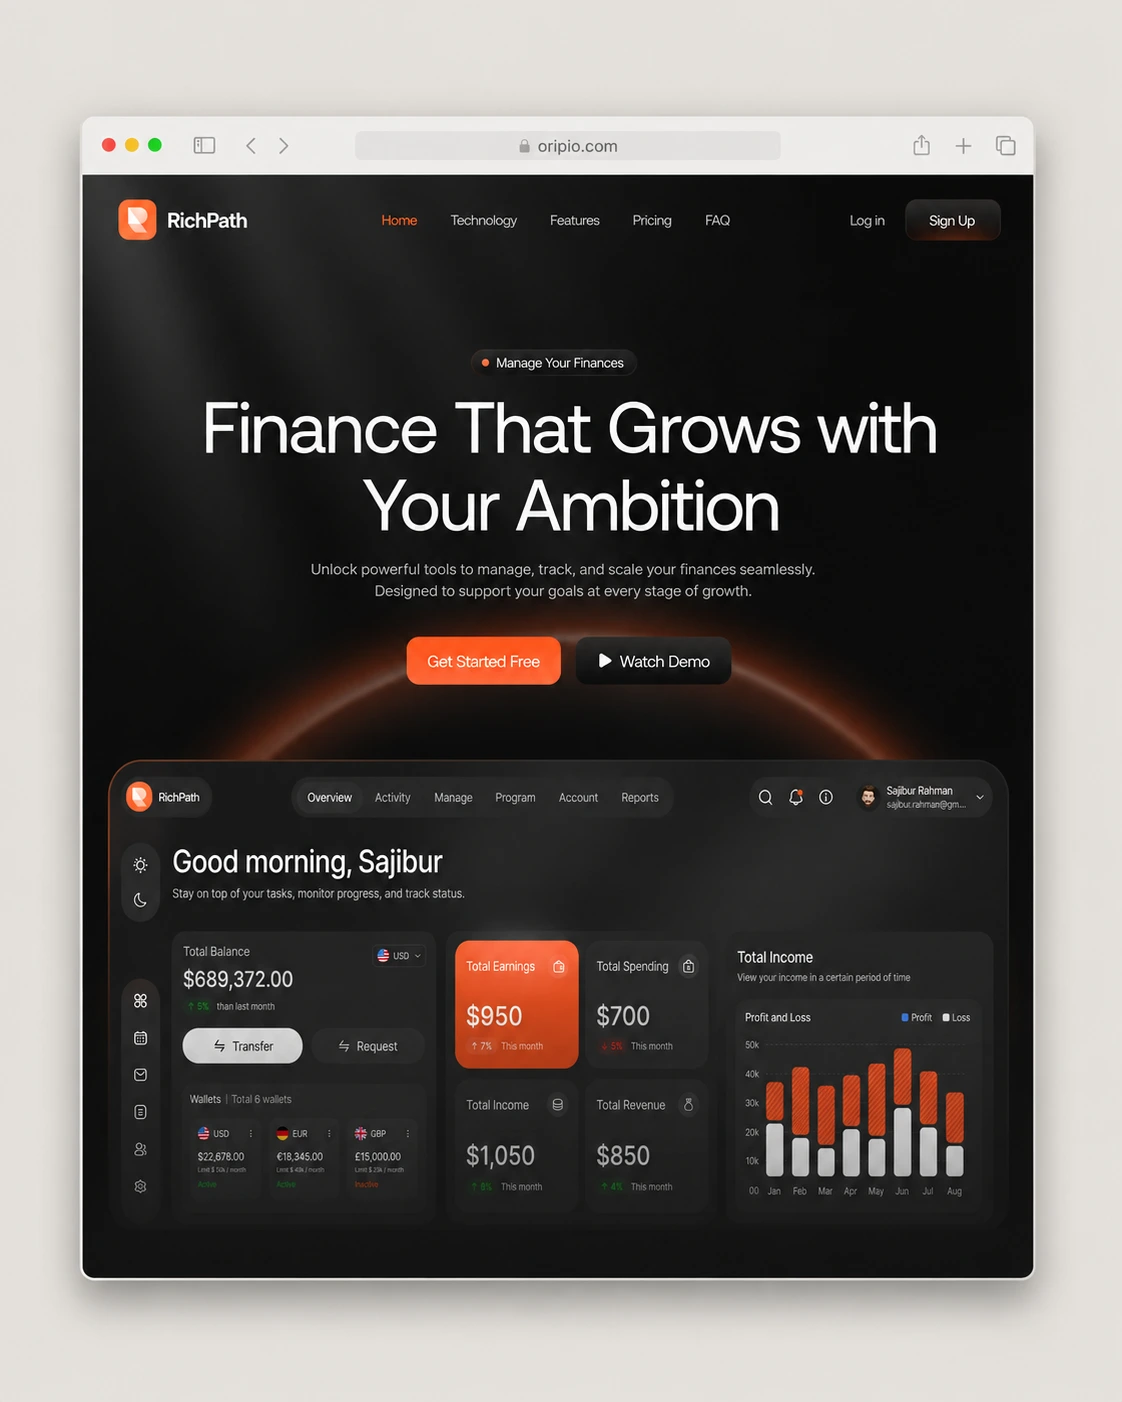
We design and develop custom, real-time dashboards that aggregate data from all your business systems into beautiful, intuitive interfaces, giving your team absolute clarity on operational health.
While tools like Tableau or PowerBI are powerful for data analysts, they are often incredibly frustrating for operational teams and executives who just need quick, actionable insights.
Critical weekly reporting still relies on someone manually downloading data, running macros, and compiling a PDF.
Standard BI tools look outdated, load slowly, and require SQL knowledge just to filter a simple date range.
Marketing looks at HubSpot, Finance looks at Xero, and Leadership has no single screen that shows the health of both.
The deliverables
We build custom dashboard applications using Next.js and modern charting libraries, delivering a premium SaaS-like experience for your internal data.
Lightning-fast, responsive web interfaces built with React and TailwindCSS for a premium user experience.
Secure Node.js backends that query, cache, and format data from your various business tools before it hits the frontend.
Implementing advanced charting libraries (Recharts, D3) to visualize complex data points clearly and interactively.
Strict authentication protocols (NextAuth, Supabase) ensuring users only see the data they are authorized to view.
Featured Dashboard Build
See how we built a unified executive dashboard that tracks live operational metrics across 4 different legacy platforms.
Executive Operations Dashboard
A mid-market logistics firm struggled with visibility. Every Friday, analysts spent 8 hours compiling reports from their fleet software, CRM, and accounting system for Monday leadership meetings.
Frequently Asked Questions
Answers covering BI tools, tech stacks, and data security.
Custom Next.js dashboards offer a far superior, frictionless user experience. They load instantly, look exactly like your brand, can be integrated directly into your own SaaS apps, and don't require expensive per-seat licensing for every user.
We don't query massive databases directly from the frontend on every load. We build intermediate API layers that cache complex queries, utilize materialized views in PostgreSQL, and aggregate data server-side so the UI remains lightning fast.
Yes. We build robust, intuitive filtering systems (by date range, region, team member, etc.) that instantly update charts and tables without requiring page reloads.
Absolutely. Because we build these as modern web applications (React/Next.js), they can easily be embedded via iframe into existing portals, or the components can be directly integrated into your proprietary SaaS codebase.
Yes. We implement enterprise-grade authentication (Oauth, SSO, SAML) and strict role-based access controls (RBAC) so employees can only access the metrics and reports relevant to their specific role.
Start your business website
Tell us about your company, required pages, existing website and functionality. We will reply with a recommended development approach, estimated timeline and scope.
Complete the form and we will respond within one business day.
Ready to replace slow, manual reporting with a beautiful, real-time dashboard? Let's discuss your metrics and data sources.
Get a Dashboard Proposal ↗